6 Composing site maps
Site maps are composed of layers of geographic information/ data. These data layers are loaded and manipulated in a Geographical Information System (GIS) such as QGIS, ArcGIS and others. After layers are correctly projected onto their corresponded geographic location and different visualization settings are applied, a layout is composed (either from scratch or from an existing site map template).The layout is then exported to PDF or geoPDF. Styled and raw data layers can can be saved into a Geopackge for a seamless transfer of geographical information between mappers and future mappers.
6.1 Examples of site maps
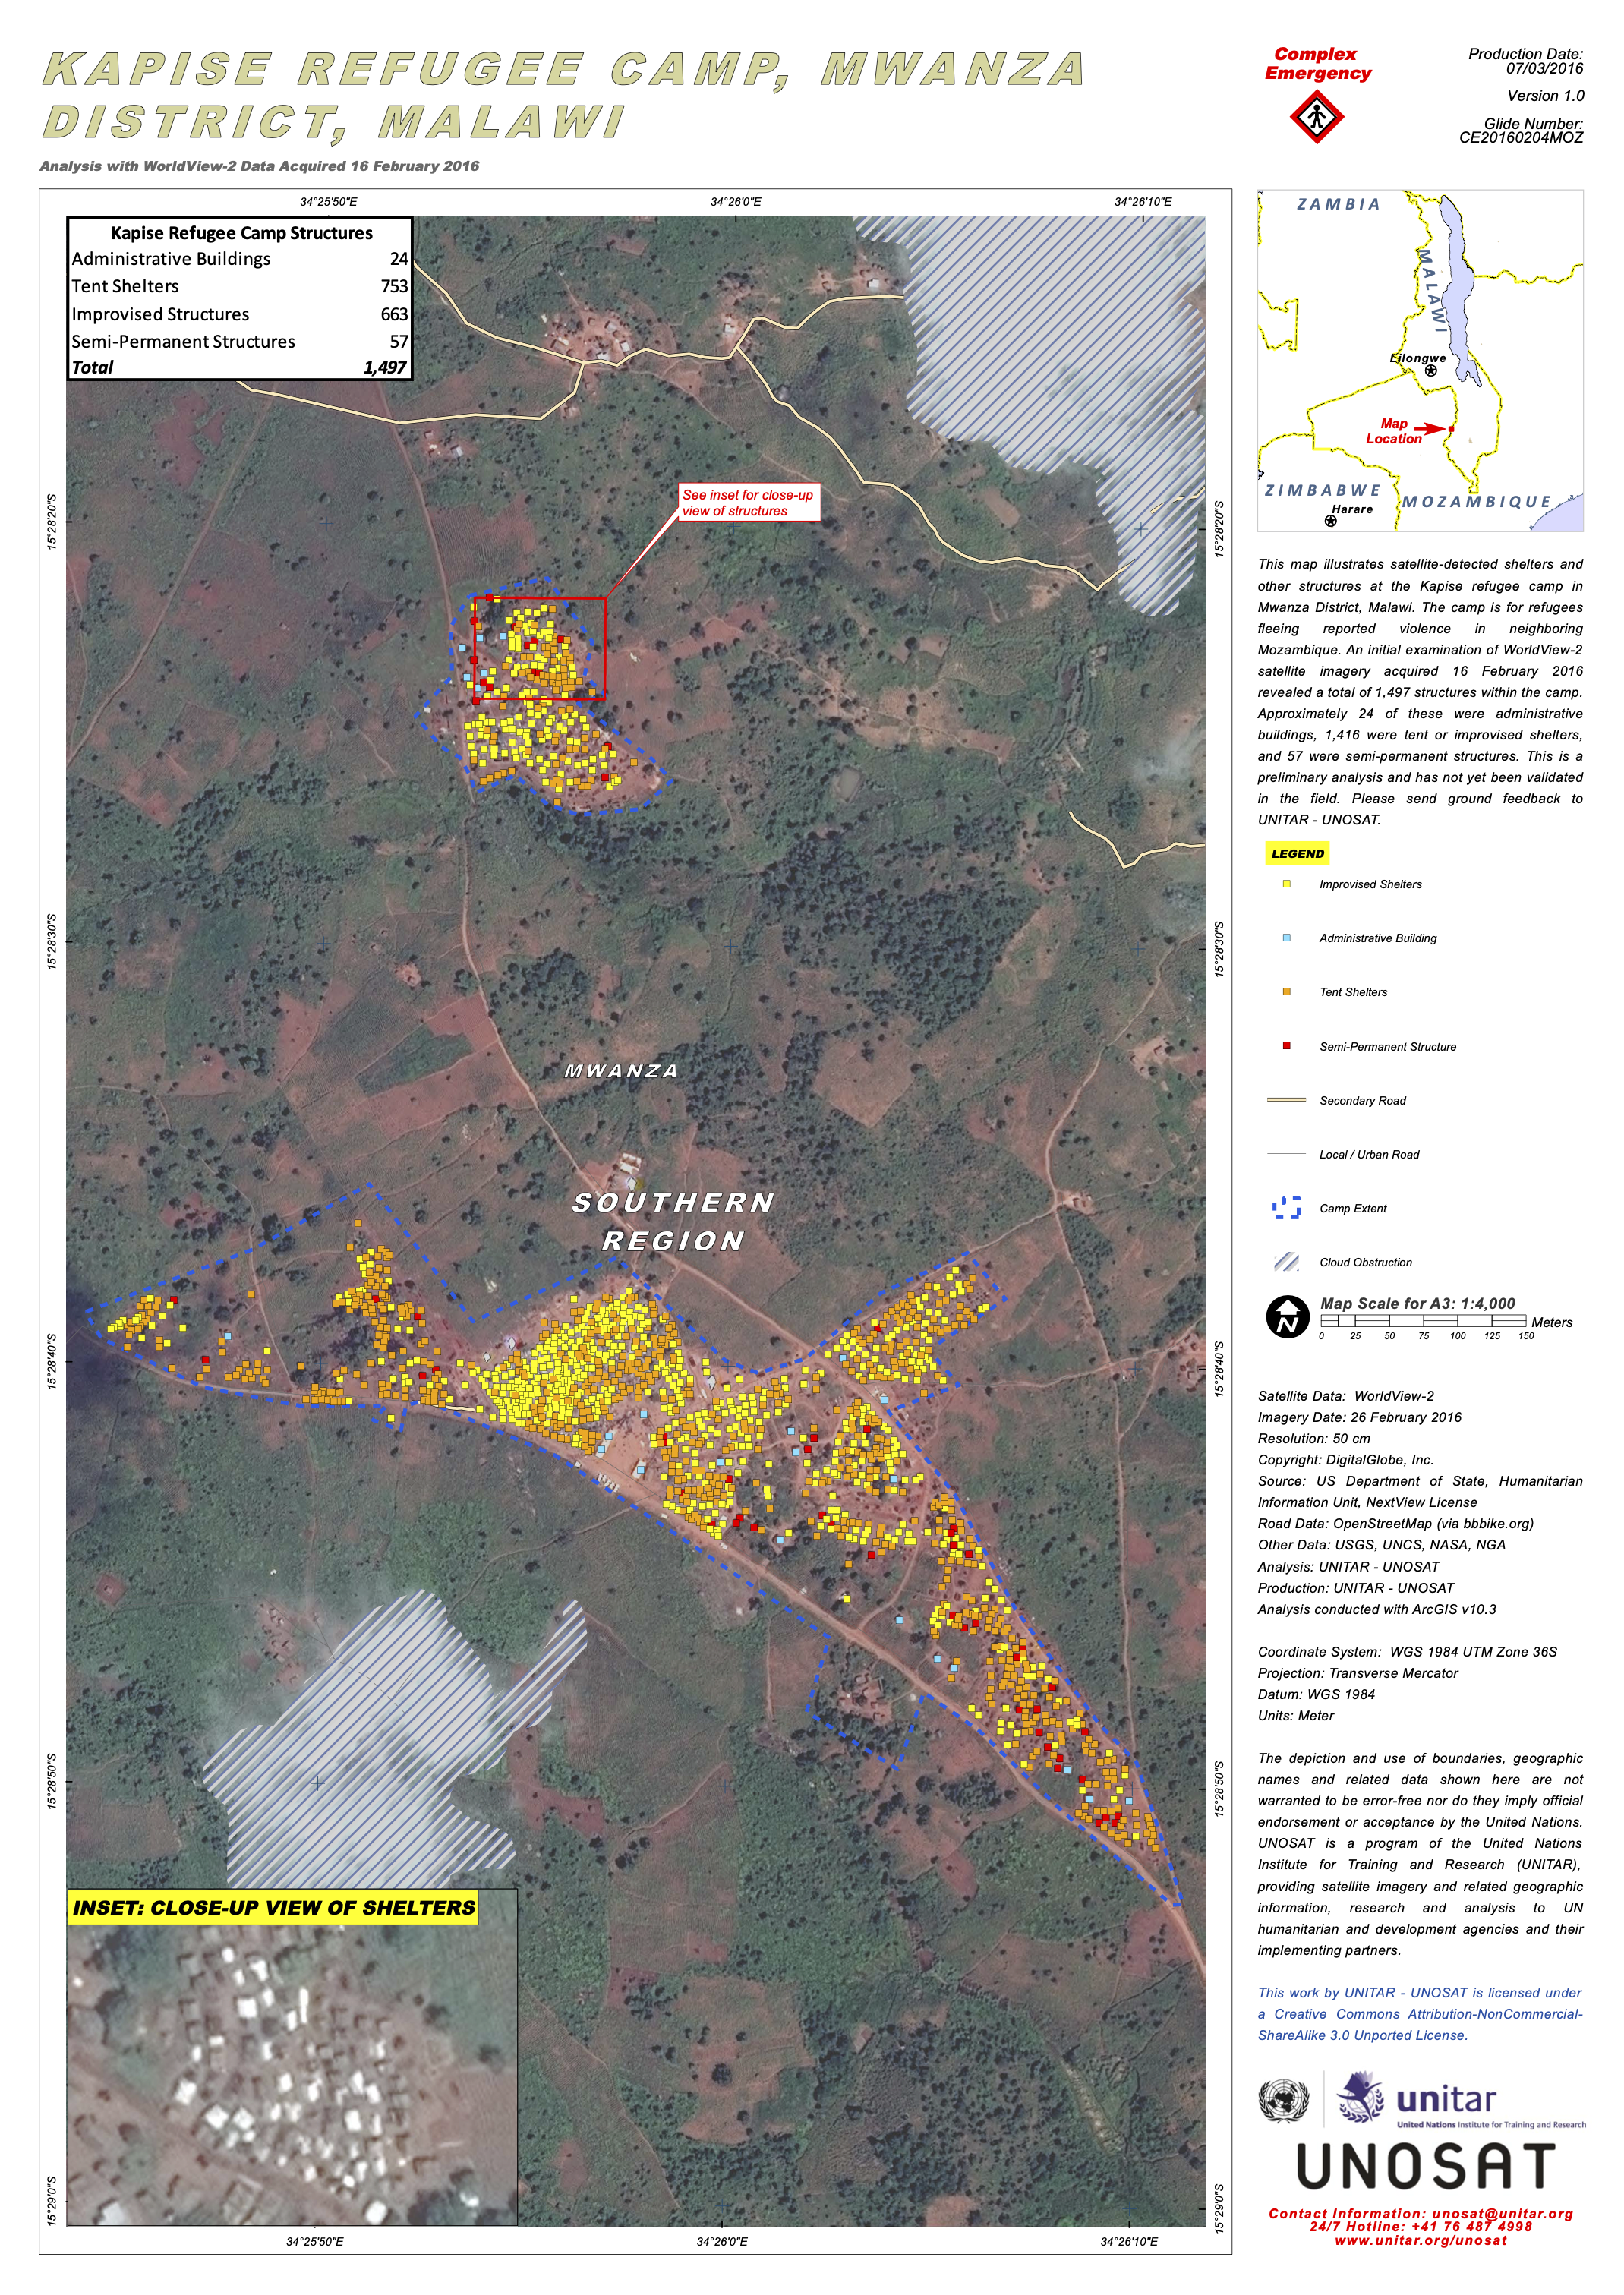
Below are some examples of site maps. More examples can be found here.


6.2 Working in GIS
GIS software can open different file types: Vector files (which use points, line segments and polygon objects to identify geographic information), Raster files/images (which use cells/ pixels to represent geographic information), and Delimited text files (such as .csv file types). For example:
| Data Layer Example | File Type |
|---|---|
| Aerial Imagery | Raster file |
| Location of healthcare facilities or service providers | Vector file |
| Population per block | Delimited Text file |
6.2.1 Loading data layers and veryfying projections
To prepare the site map, load the data layers into a GIS workspace, such as QGIS.
Most publicly available geographic information datasets are projected in a world Coordinate Reference System (CRS) (WGS 84). When loading a layer projected in a whole world CRS, the layer will look slightly distorted in the workspace. Ensure that the Project CRS is set to the area of your site location. You can use the epsg.io database of coordinate systems to know the coordinate system you should be using for you context. All loaded data layers need to be checked and projected where needed, according to the project CRS.
6.2.2 Layers and elements of a site map
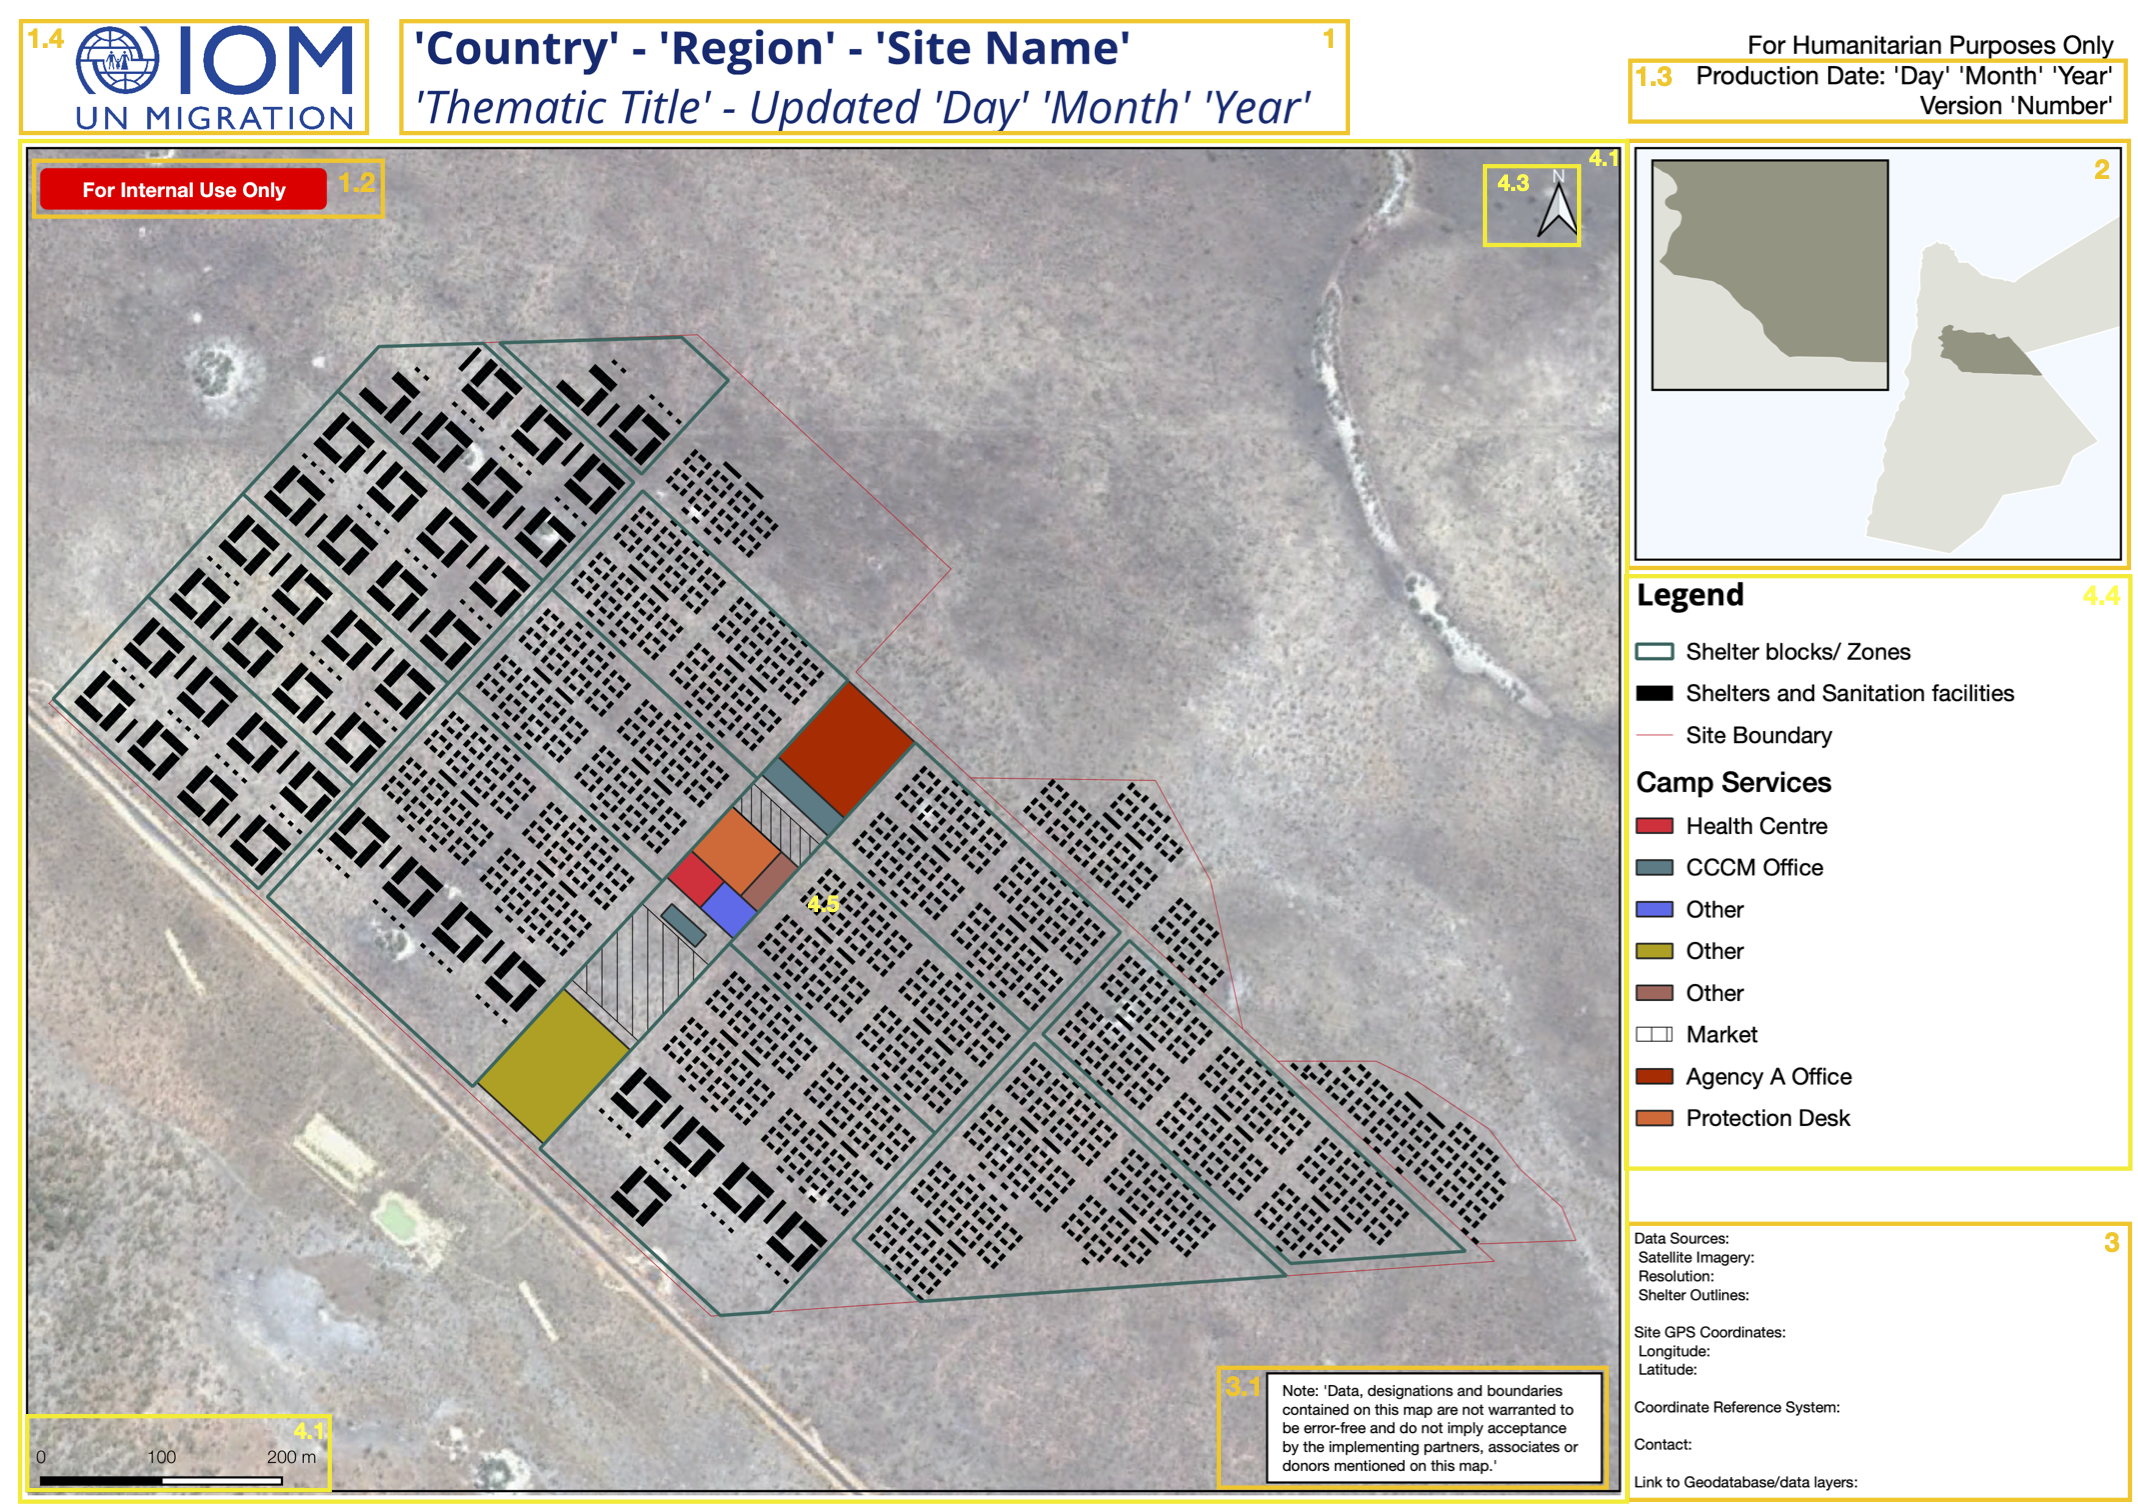
This guide is accompanied by a site map template which can be loaded into QGIS’s Print Composer. Below is a dummy example of a site map produced using [this template](.

Source: IOM
For the purposes of supporting a standardized approach to the production of static site maps, and ensuring new site maps can be compared and used alongside existing maps, the template provided in this Site Mapping Guide is one approach to laying out a site map, however this can and should be adapted based on the context and its audience.
The following list of layers and elements can be included in the final output:
Title and Subtitle (1)
- Country
- State
- Site Name
- Thematic Title
- Date site map was last updated
Site map audience/ permission/ sharing restrictions (1.2)
Production date and version number of site map (1.3)
Agency/ NGO Logos (1.4)
Inset maps (2)
- At Country/ Regional level
- At Regional/ Area level
Notes (3)
- Data sources
- Satellite Imagery source
- Imagery Resolution
- Coordinate system
- Site GPS coordinate points
- Agency/ NGO Logo
- Contact
- Link to Geodatabase/ corresponding data layers
- Disclose limitations regarding accuracy of site map (3.1)
Map
- Base Map (satellite/ aerial imagery) (4.1)
- Scale bar (4.2)
- Orientation indicators (4.3)
- Legend (4.4)
- Camp Infrastructure (4.5) :
- Shelters
- Shelter blocks
- Zones
- WASH facilities
- Water points
- Education facilities
- Health Facilities
- Distribution points (Food/ NFI)
- Markets(s)
- Information desks
- CFM desks
- Other camp facilities
- Movement network (Roads, pathways)
- Community areas/ centre
- Religious buildings/ spaces
- Site Entrance(s)
- Site boundary
- Security facilities or guard points
- Fences/ Camp Boundaries
Environment
- Host community
- Green belt
- Trees/ Vegetation
- Agricultural land
Optional additional labels:
- Functioning/ non-functioning facilities
- Male/ female latrines
- Unusable area
- Agency responsibility for each section of the site
- Shelter numbers/ Addressing
- Summary information/ figures
- Site population (households and individuals)
- Site area
- Total no. of shelters
- Shelter type and size
- Quantity of sanitation blocks/ latrines/ showers
- Type of water supply
- Total no. of water points
6.2.3 Visualizing data layers
Once the files are opened in QGIS, they will appear as layers. These layers can be duplicated in order to show different visualisations of the same file.
6.2.4 Adding fields and editing attributes
Shapefiles (ESRI Shapefile format) are the most common type of vector file. This file format dataset consists of several files. Of these different files, there are two which you should be familiar with for the purposes of this site mapping exercise. First, the .shp file, which contains the geometries of the features in the layer and secondly, the .dbf file, which contains the feature attributes.
The attribute table interface allows you to view and [edit the attribute data] (https://docs.qgis.org/3.22/en/docs/user_manual/working_with_vector/attribute_table.html#editing-attribute-values) as well as interact with features in a layer (by selecting or filtering features for example). Fields are columns of attribute values and these can be added, deleted and edited through this interface.
Any saved changes made to a data layer in QGIS will also change the source file. If you wish to edit/ delete or add features or attribute values to a layer but do not want to edit the original source file, save the layer as a separate file before making your edits. Additionally, removing a layer will remove it from the work space but will not delete it from your source folder.
6.2.5 Print Layouts and Using Templates
With QGIS’s layout composer, you can create layouts or use existing layout templates. The template file can be downloaded here. Once the layout is complete, save and export the print layout as an image, an svg (for future editing in other software such as Adobe Illustrator or InkScape, select export as vectors), or as a PDF. If saving as a PDF, consider saving the layout as a GeoPDF by selecting ’Create Geospatial PDF (GeoPDF) in the export PDF settings (refer to Section 7: Collaboration for why you should export your site map alsp as a GeoPDFs)
6.2.6 Saving the data layers and styles into a Geopackage
Data layers are saved on your local computer. To facilitate sharing geographic information, data layers can be compressed into a Geopackage. The QGIS project and all the data used in the project can be saved using the Package Layers tool and easily shared and stored as such for future use.
